The high-voltage pack from four sides: what it holds right now, how its cells compare, how warm it is, and how it is ageing.
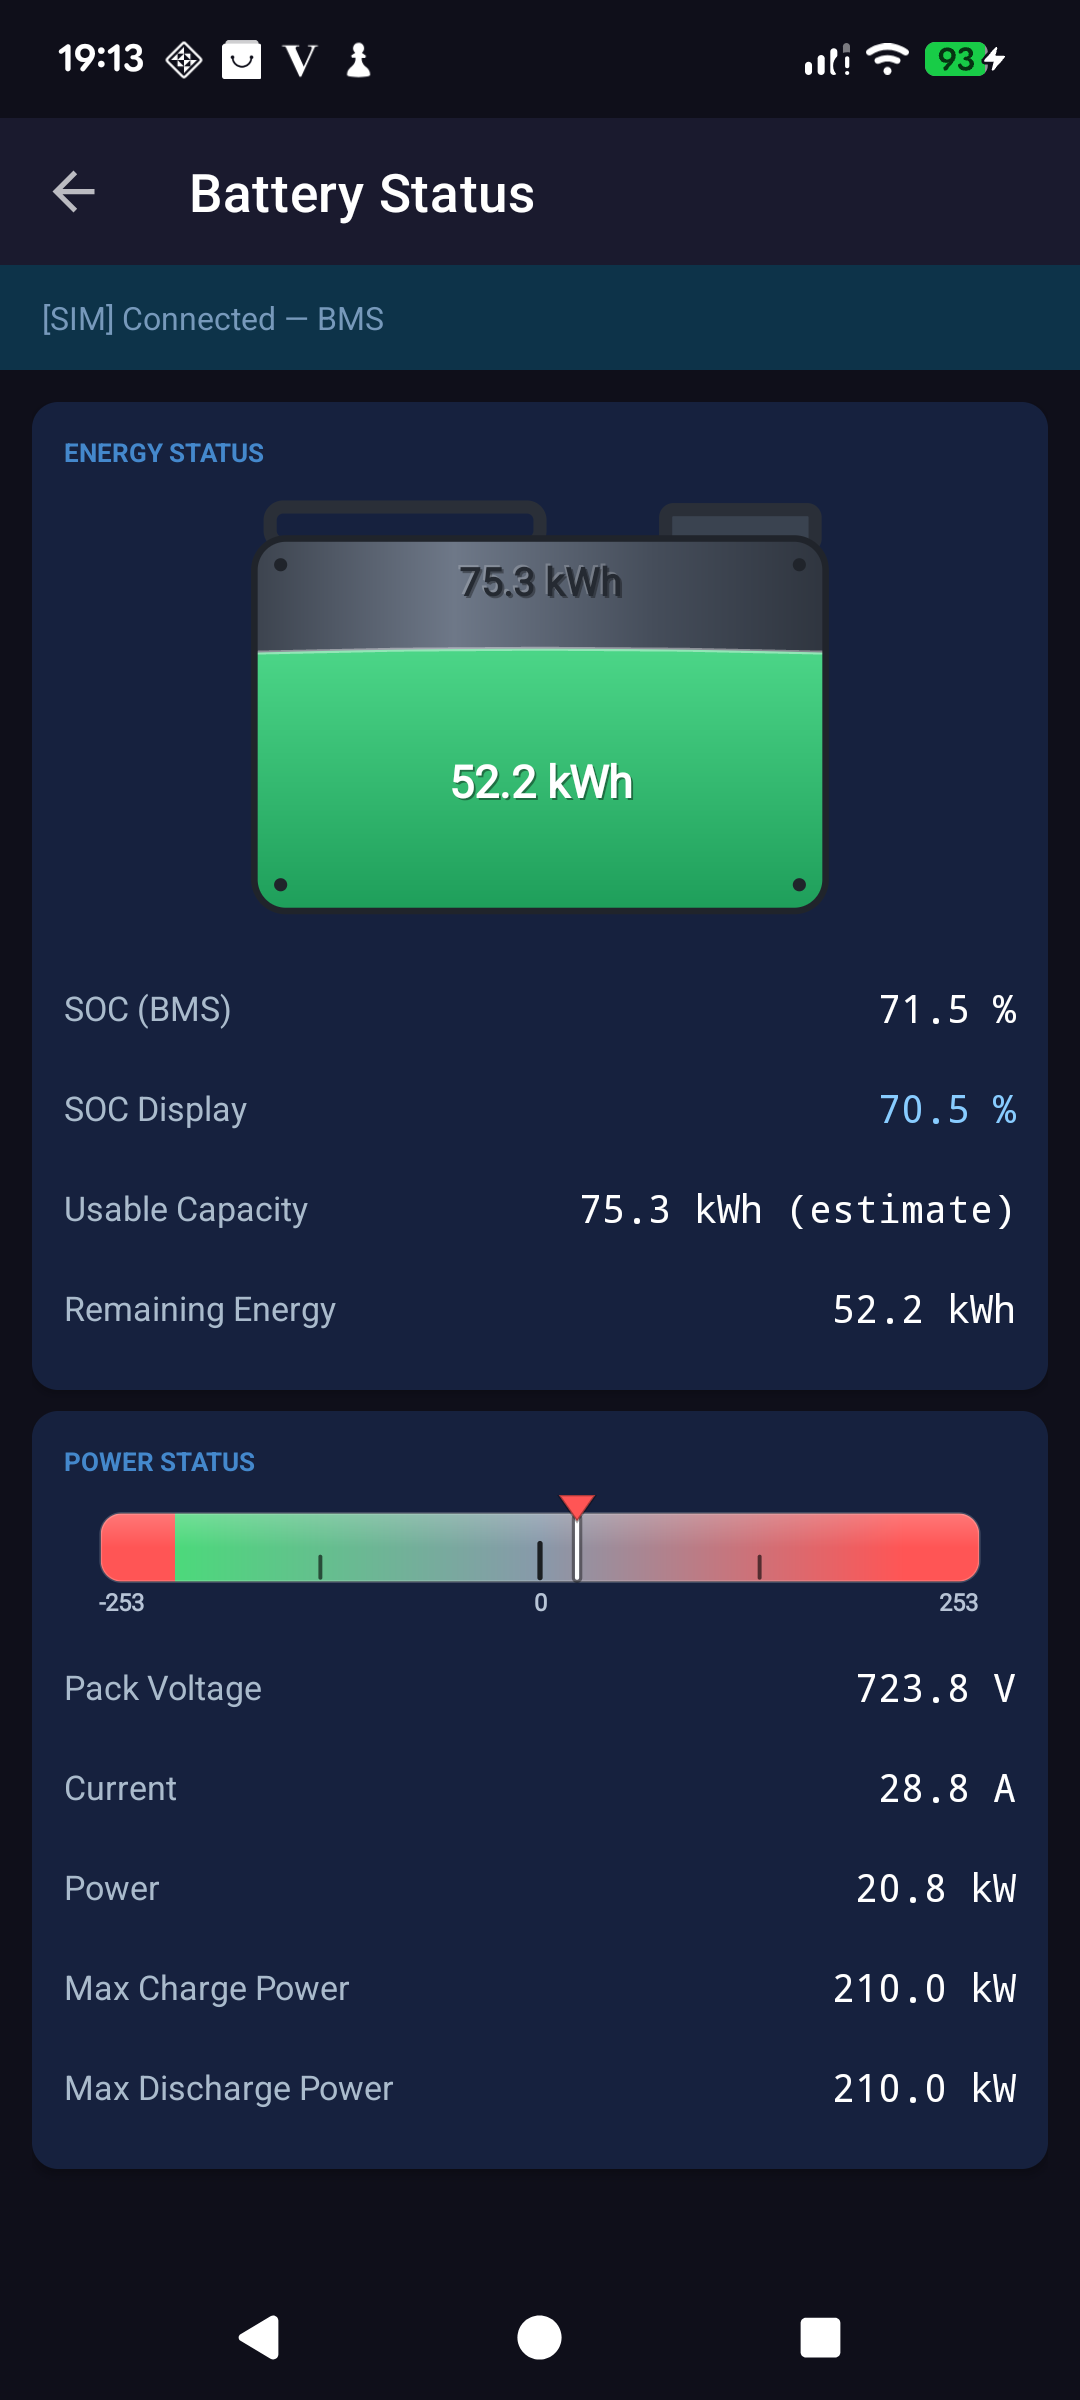
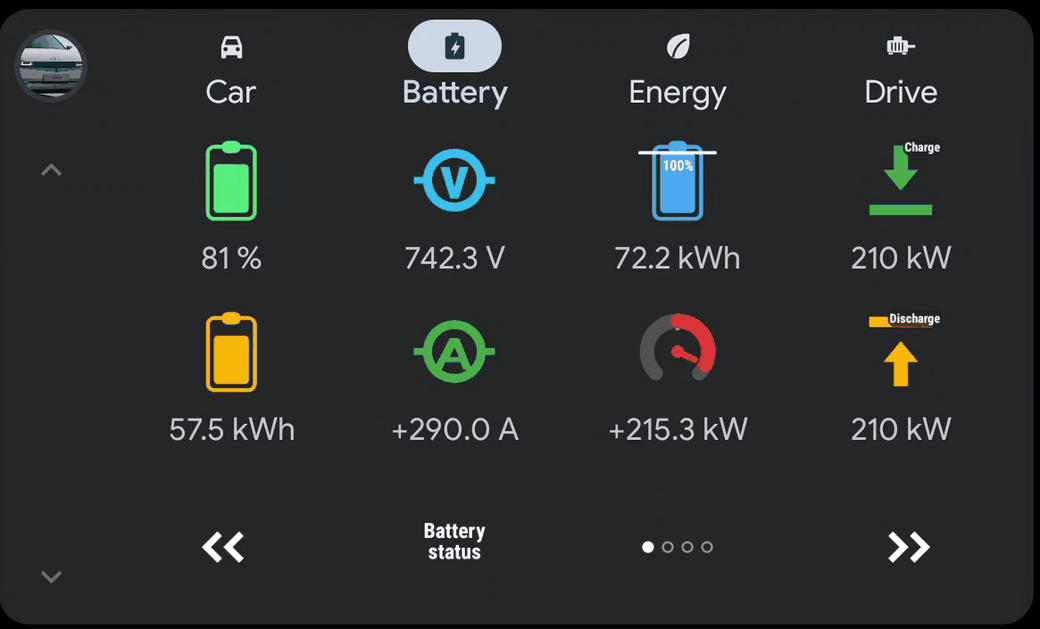
The Battery Status screen gives you the whole high-voltage battery at a glance. The "fuel tank" graphic at the top fills like a petrol gauge: the green level is the energy available right now (Remaining Energy in kWh) against the battery's total Usable Capacity. Below it you get SOC (BMS), the true state of charge the battery management system works with, alongside SOC (Display), the slightly buffered figure shown on the car's own cluster.
This app measures your battery capacity. The car never reports its capacity directly, but it does report, continuously, how much energy is left and what the true state of charge is. Watched over time, those two numbers contain the answer. Every percent of charge you use or add is a small experiment, and the app quietly keeps score.
How it works. The app records how many kWh sit behind each single percent of real state of charge: the slope. Once it has seen your car at two charge levels far enough apart, it fits that slope across the widest span it has observed, and the capacity follows directly: energy remaining now, plus the slope multiplied by the percent still to go. Because the figure is anchored on the car's live remaining energy rather than on a stored constant, it re-derives itself on every reading. So as the pack ages, the number comes down with it, on its own.
You can watch it grow up. On day one it shows a single-reading estimate, corrected for the quirk that the car's "remaining energy" reaches zero at roughly 7 % real charge rather than at 0 %. As you drive and charge, the observed span widens and the label tells you exactly how much evidence is behind the number: first (estimate), then the actual range it has measured across, such as (18–84 %), and finally (verified) once it has seen a span of 60 % or more. Nothing is hidden: the app tells you how confident it is.
The calibration is tied to your car's VIN, so plugging into a different IONIQ 5 starts a fresh measurement rather than quietly reporting the wrong car's pack. Implausible results are rejected rather than displayed. And the whole thing needs no input from you: no model selection, no full charge-discharge cycle to "learn" the battery. Just use the car.
The Power Status bar is a live, two-ended dial. The pointer sits in the middle at rest and swings left into the green when energy is flowing into the battery (regenerative braking or charging) and right into the red when power is being drawn out (accelerating). The ends of the scale match the battery's current limits, so you can instantly see how hard the pack is working relative to what it will allow.
Reading it: centre = coasting/parked · left = charging / regen · right = discharging (driving). The further the pointer travels, the higher the kW. Max Charge / Discharge Power below show the ceilings the BMS is allowing right now, which is why charging or regen can feel reduced when the pack is cold.
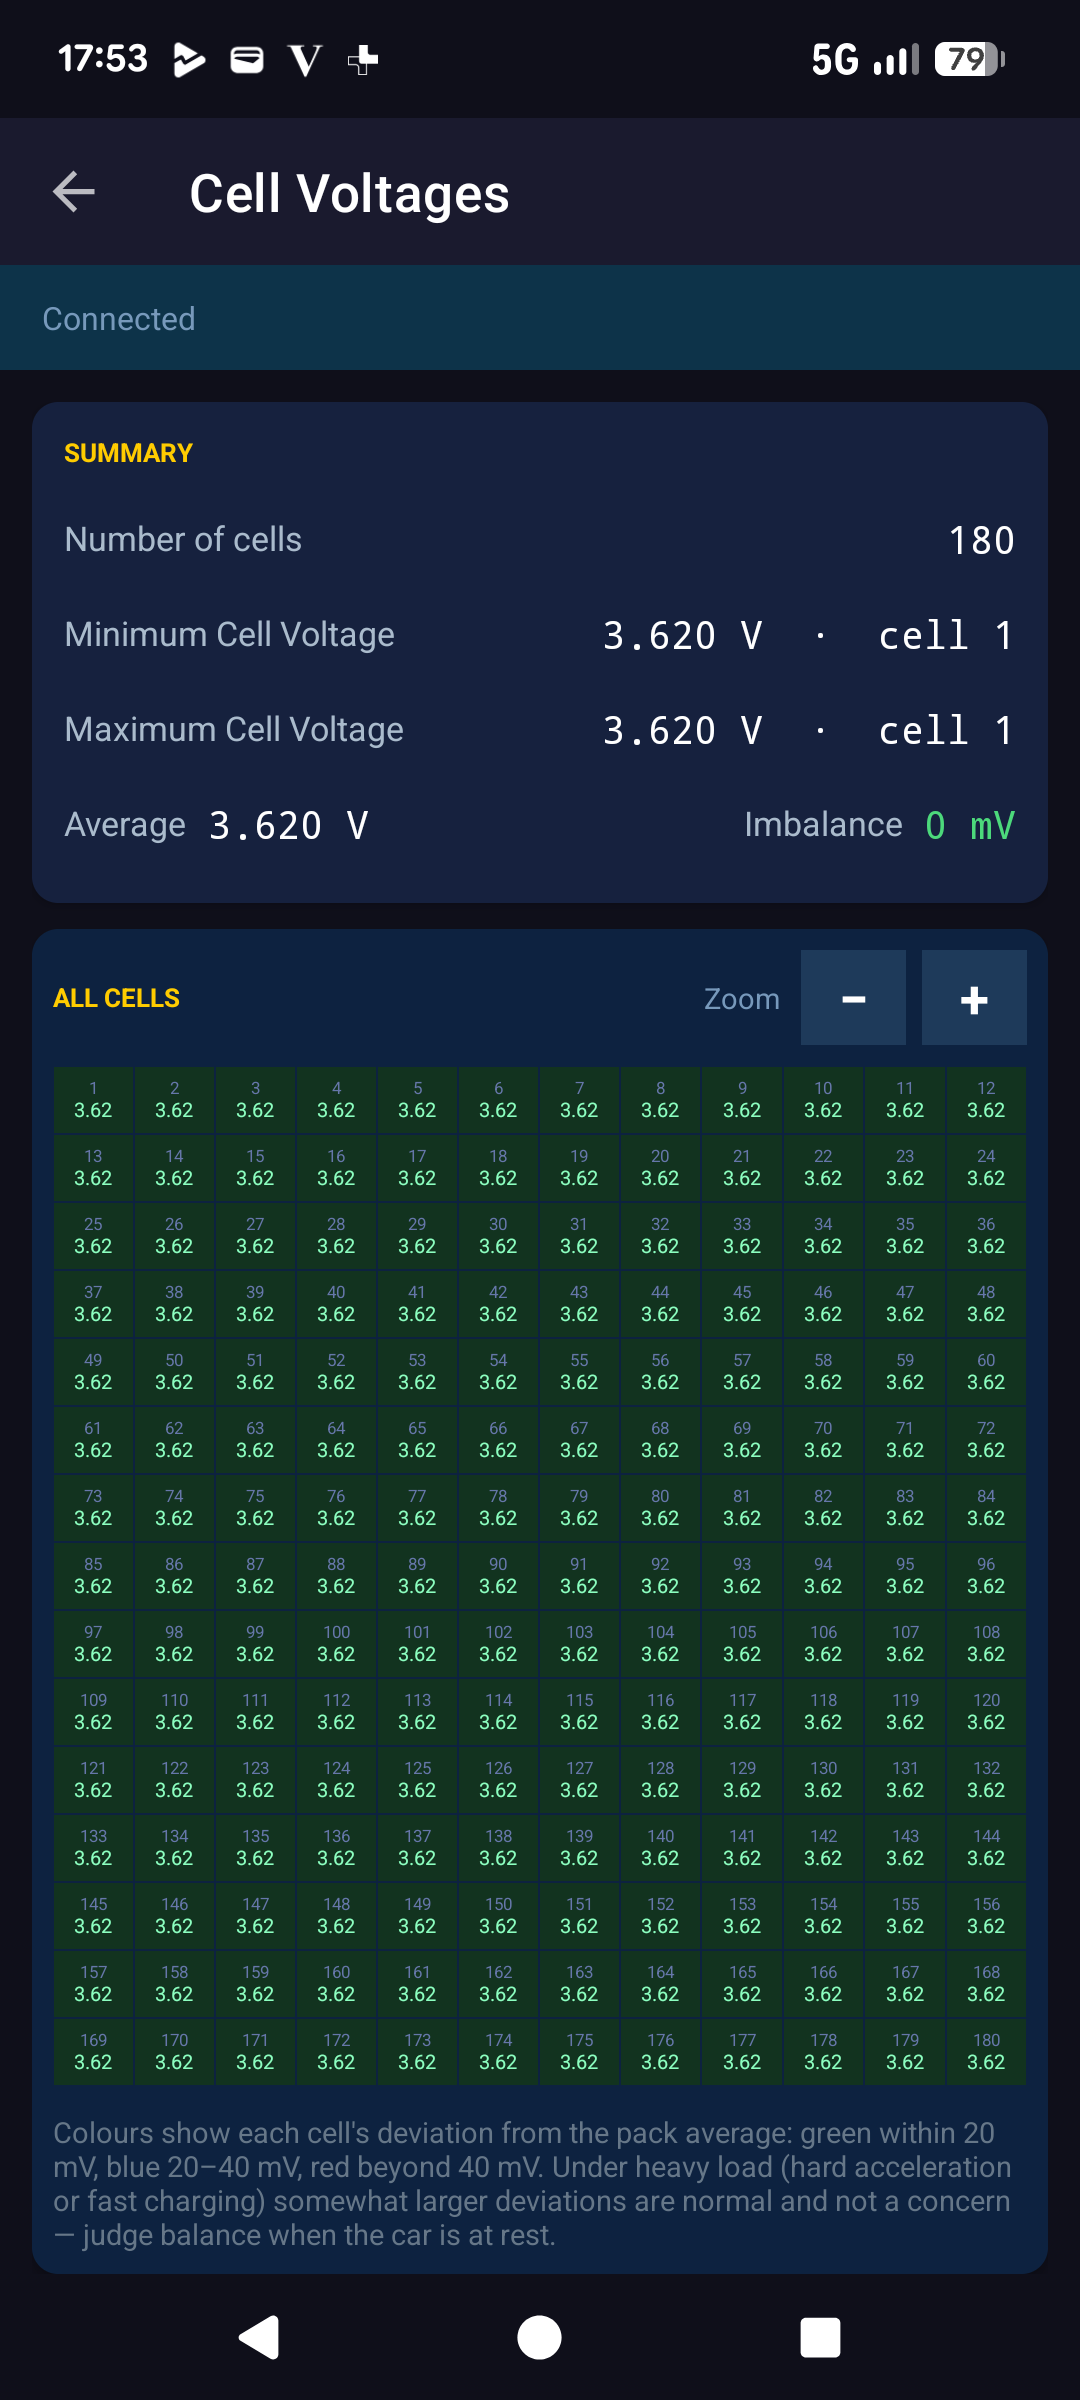
The IONIQ 5 battery pack contains a long string of individual lithium cells. This screen shows the voltage of every single cell on a colour-coded grid. The colour is not the raw voltage but each cell's deviation from the pack average: cells close to average stay green, while cells that sit increasingly above or below the average shift towards red, so an outlier drifting away from the pack jumps straight out at you. You can zoom into the grid to read individual cells more comfortably.
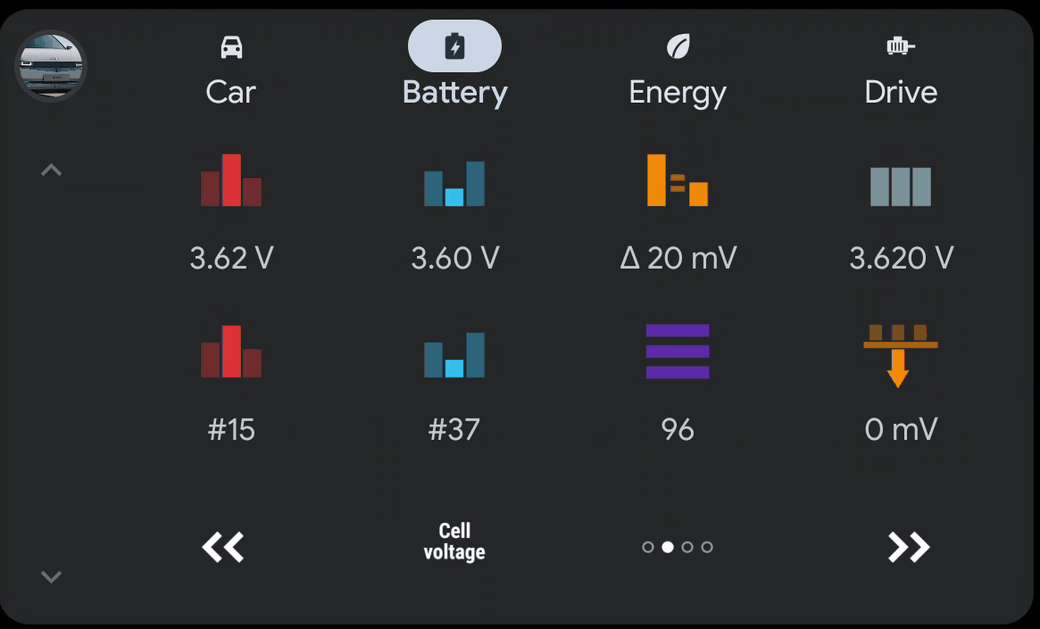
The summary shows the minimum, maximum and average cell voltage plus the imbalance, the gap between the strongest and weakest cell. A few millivolts of imbalance is perfectly normal; a large or steadily growing gap is the earliest sign of a tiring cell, often long before the overall State of Health moves.
It is most revealing right after a long drive or a fast-charge session, when any weak cell has the hardest time keeping up with the rest of the pack.
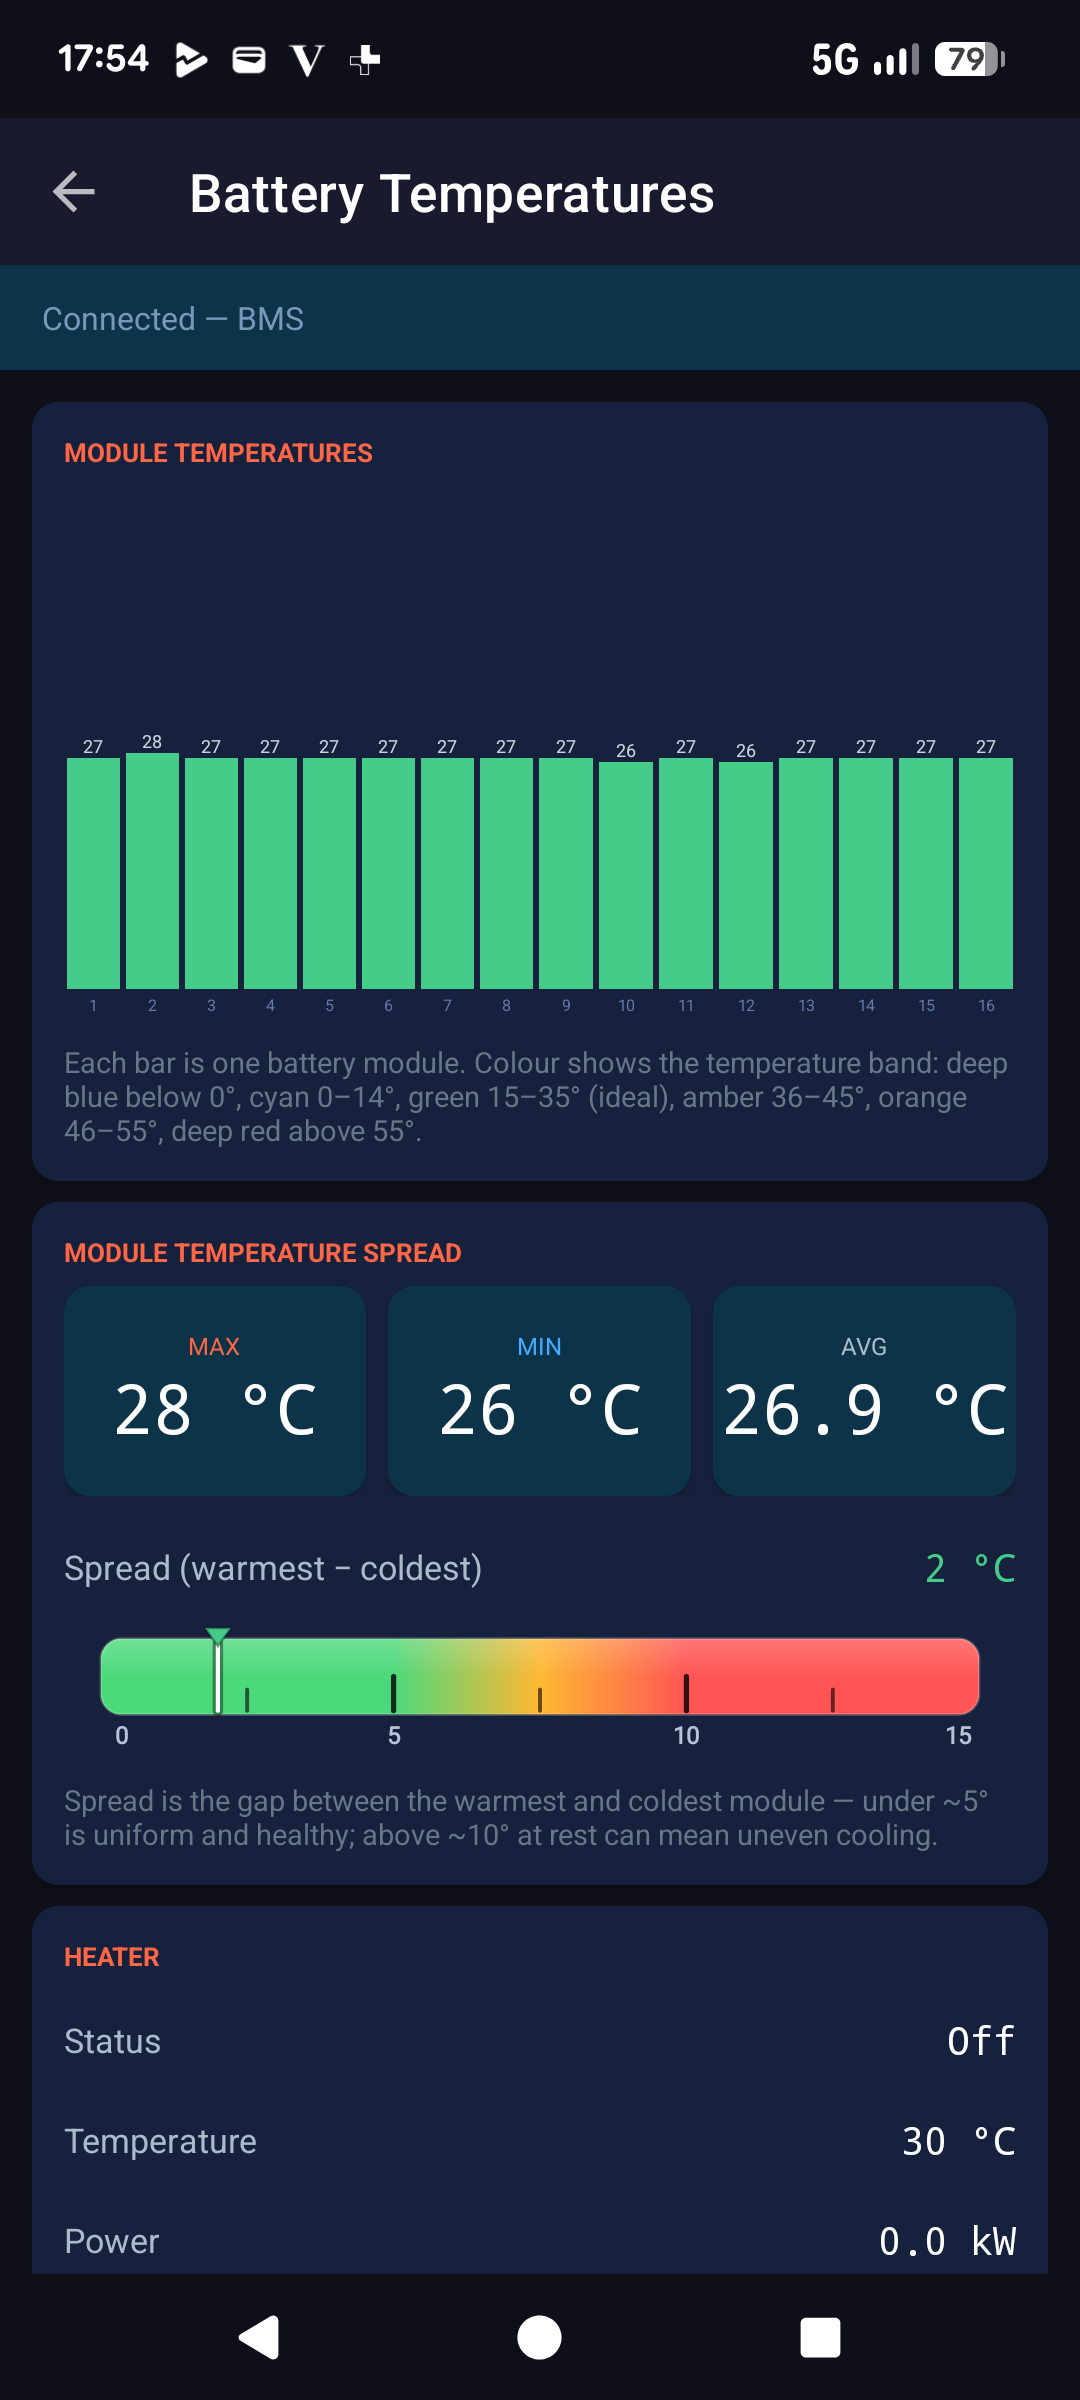
Temperature drives charging speed, range and battery longevity. The top chart shows one bar per battery module, and each bar is colour-banded by temperature: deep blue below 0°, cyan 0–14°, green 15–35° (the ideal window), amber 36–45°, orange 46–55° and deep red above 55°. One glance tells you whether the whole pack is in its happy zone.
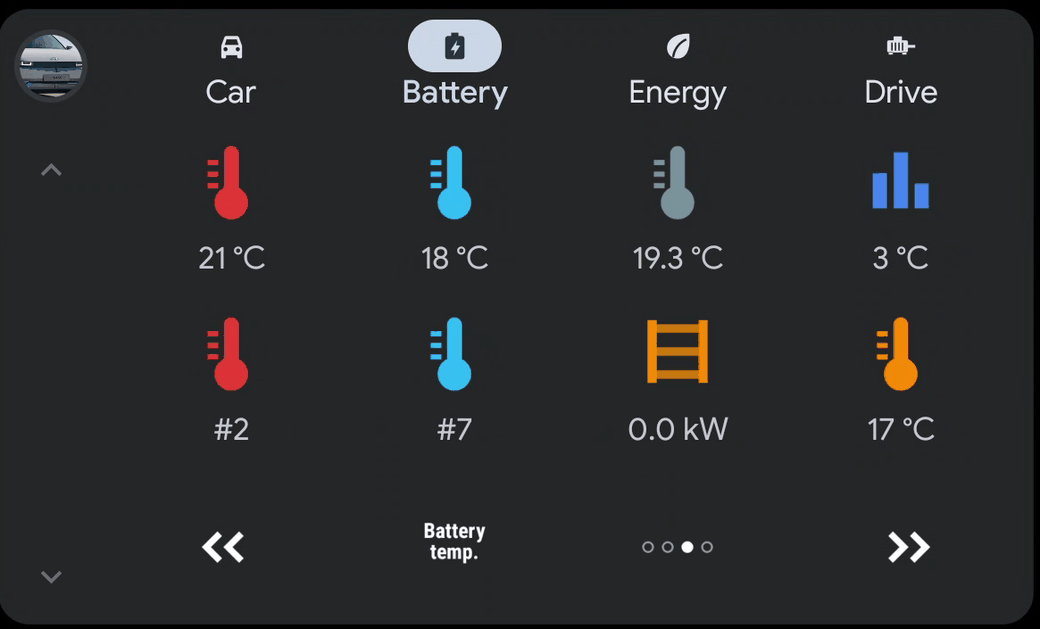
Below the modules, the Spread dial shows the gap between the warmest and coldest module on a 0–15°C scale that runs green → red.
Reading it: under ~5°C of spread is uniform and healthy; above ~10°C while the car is at rest can point to uneven cooling worth keeping an eye on. The Heater section then shows whether battery pre-conditioning is active, its temperature and how much power it is drawing, exactly what the car does before a winter fast charge.
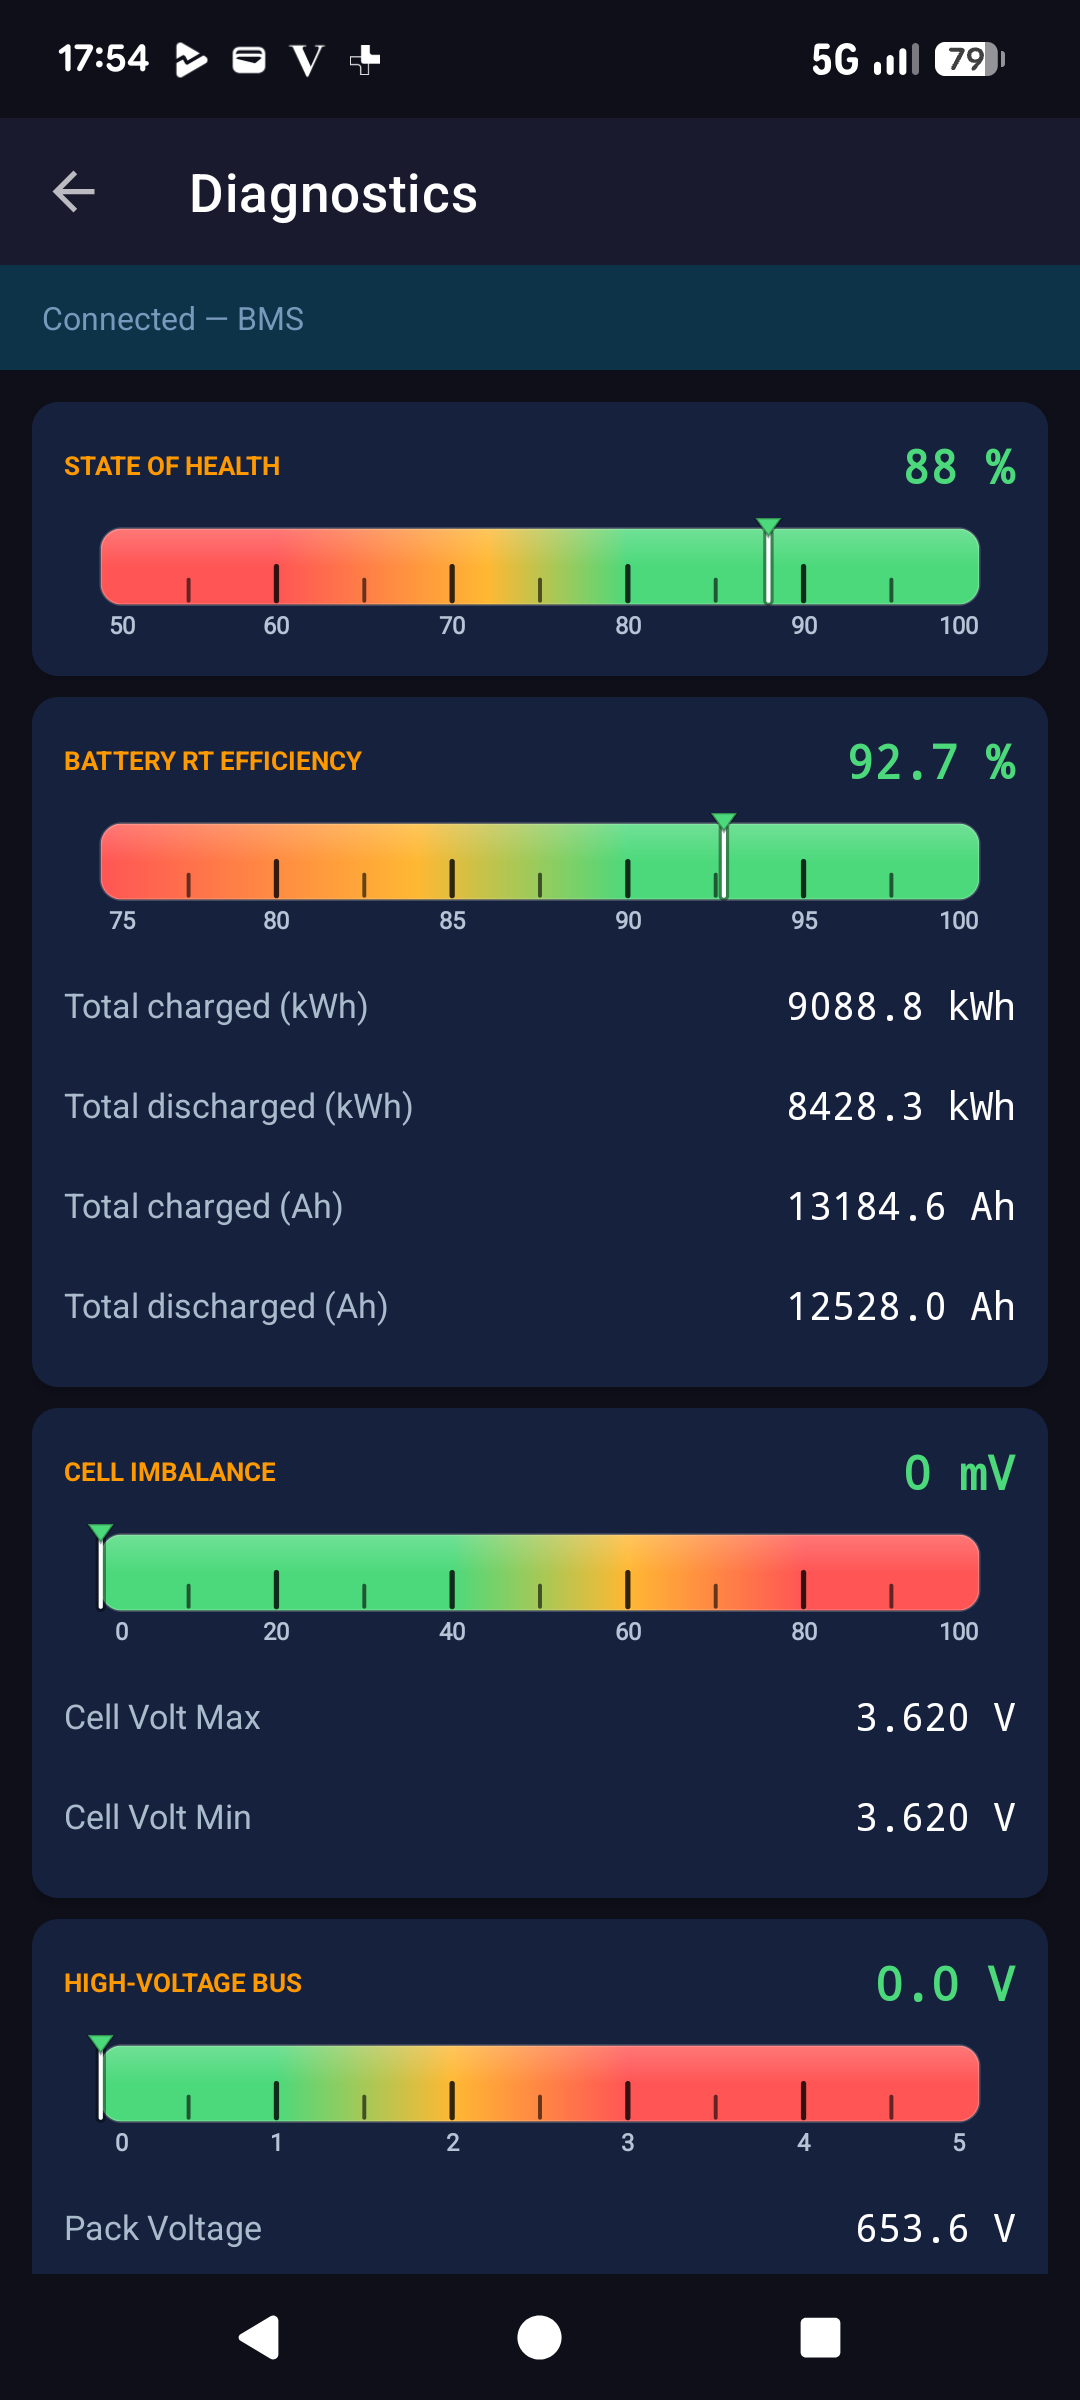
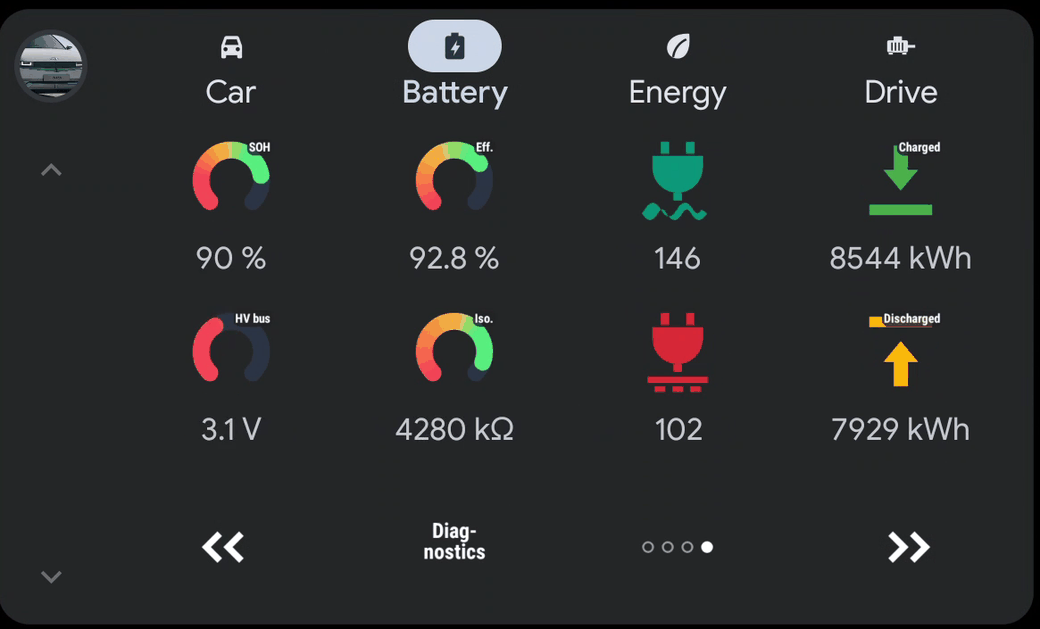
The Diagnostics screen turns the most important health figures into a stack of colour-graded dials, one card each, so you can judge the pack's condition in seconds. The cards are laid out below in the order they appear on the screen. They are not equally important, though: the single best predictor of trouble is Cell Imbalance, which has its own card further down.
State of Health (50 to 100%) is reported directly by the car and tells you how much of the original capacity the pack has kept, so fuller and greener is better. Useful to know, but read it for what it is: a slow measure of range, not a warning light. It drifts down a few percent in the first year or two and then a percent or so a year. It will not spot a single cell about to fail. That is the job of Cell Imbalance, below.
Round-Trip Efficiency (50 to 100%) is how much energy you get back out versus what you put in. Higher and greener is better. A pack that is quietly getting less efficient over time is doing more of its work as heat, which is a gentle sign of ageing. Beneath this card the screen lists the lifetime totals the BMS has counted since the car was built: charged and discharged kWh and Ah.
If you read only one dial on this screen, read this one. Cell Imbalance (0 to 100 mV) is the gap between the highest and lowest cell voltage in the pack, and it is the best early warning of a weak or failing cell. It matters more than State of Health for reliability: a pack fails because one cell goes bad, and that shows up here long before it shows up anywhere else. Low and green is healthy; a long red bar means the cells are drifting apart. The max and min cell voltages behind the figure are listed on the card.
Reading it: judge it at rest, ideally a few hours after charging so the BMS has had time to balance. Under about 10 mV is excellent, up to ~40 mV is normal, 40 to 80 mV is worth watching, and above ~100 mV (especially half a volt or more) points to a failing cell that may need a module replacement. The spread naturally widens at very high or very low charge and under load, so compare like with like.
The High-Voltage Bus dial shows the DC-link gap: the battery pack voltage minus the inverter's DC-link capacitor voltage while the main contactor is closed, on a 0 to 5 V scale. With the bus live the capacitor sits right across the pack, so this gap is essentially the small voltage drop across the contactor and busbars, and lower and greener is better. A reading near 0 V (green) means a healthy, well-connected bus; a growing gap (amber → red) points to extra resistance in the high-voltage path. When the bus is not live (main contactor open, car asleep) the dial simply shows a dash. Pack voltage, capacitor voltage and link status are listed beside it.
The Insulation Resistance dial tracks the electrical isolation between the high-voltage system and the car body, and here higher is better (a healthy pack reads well above 1000 kΩ). This is a safety figure: if it falls far enough the car itself will warn you and can refuse to drive, because it means current could leak to the chassis.
The last card is a row of fault flags that light up only if the BMS has ever recorded a problem: an over- or under-voltage, over- or under-temperature, over-current, short-circuit or isolation fault. On a healthy pack they all stay clear. It is the first place to look if the car has thrown a battery warning.