Energy screens

Energy in and energy out: what a charger is delivering, how the 12 V side is fed, and how far the energy left will take you.

Charging screen

Charging

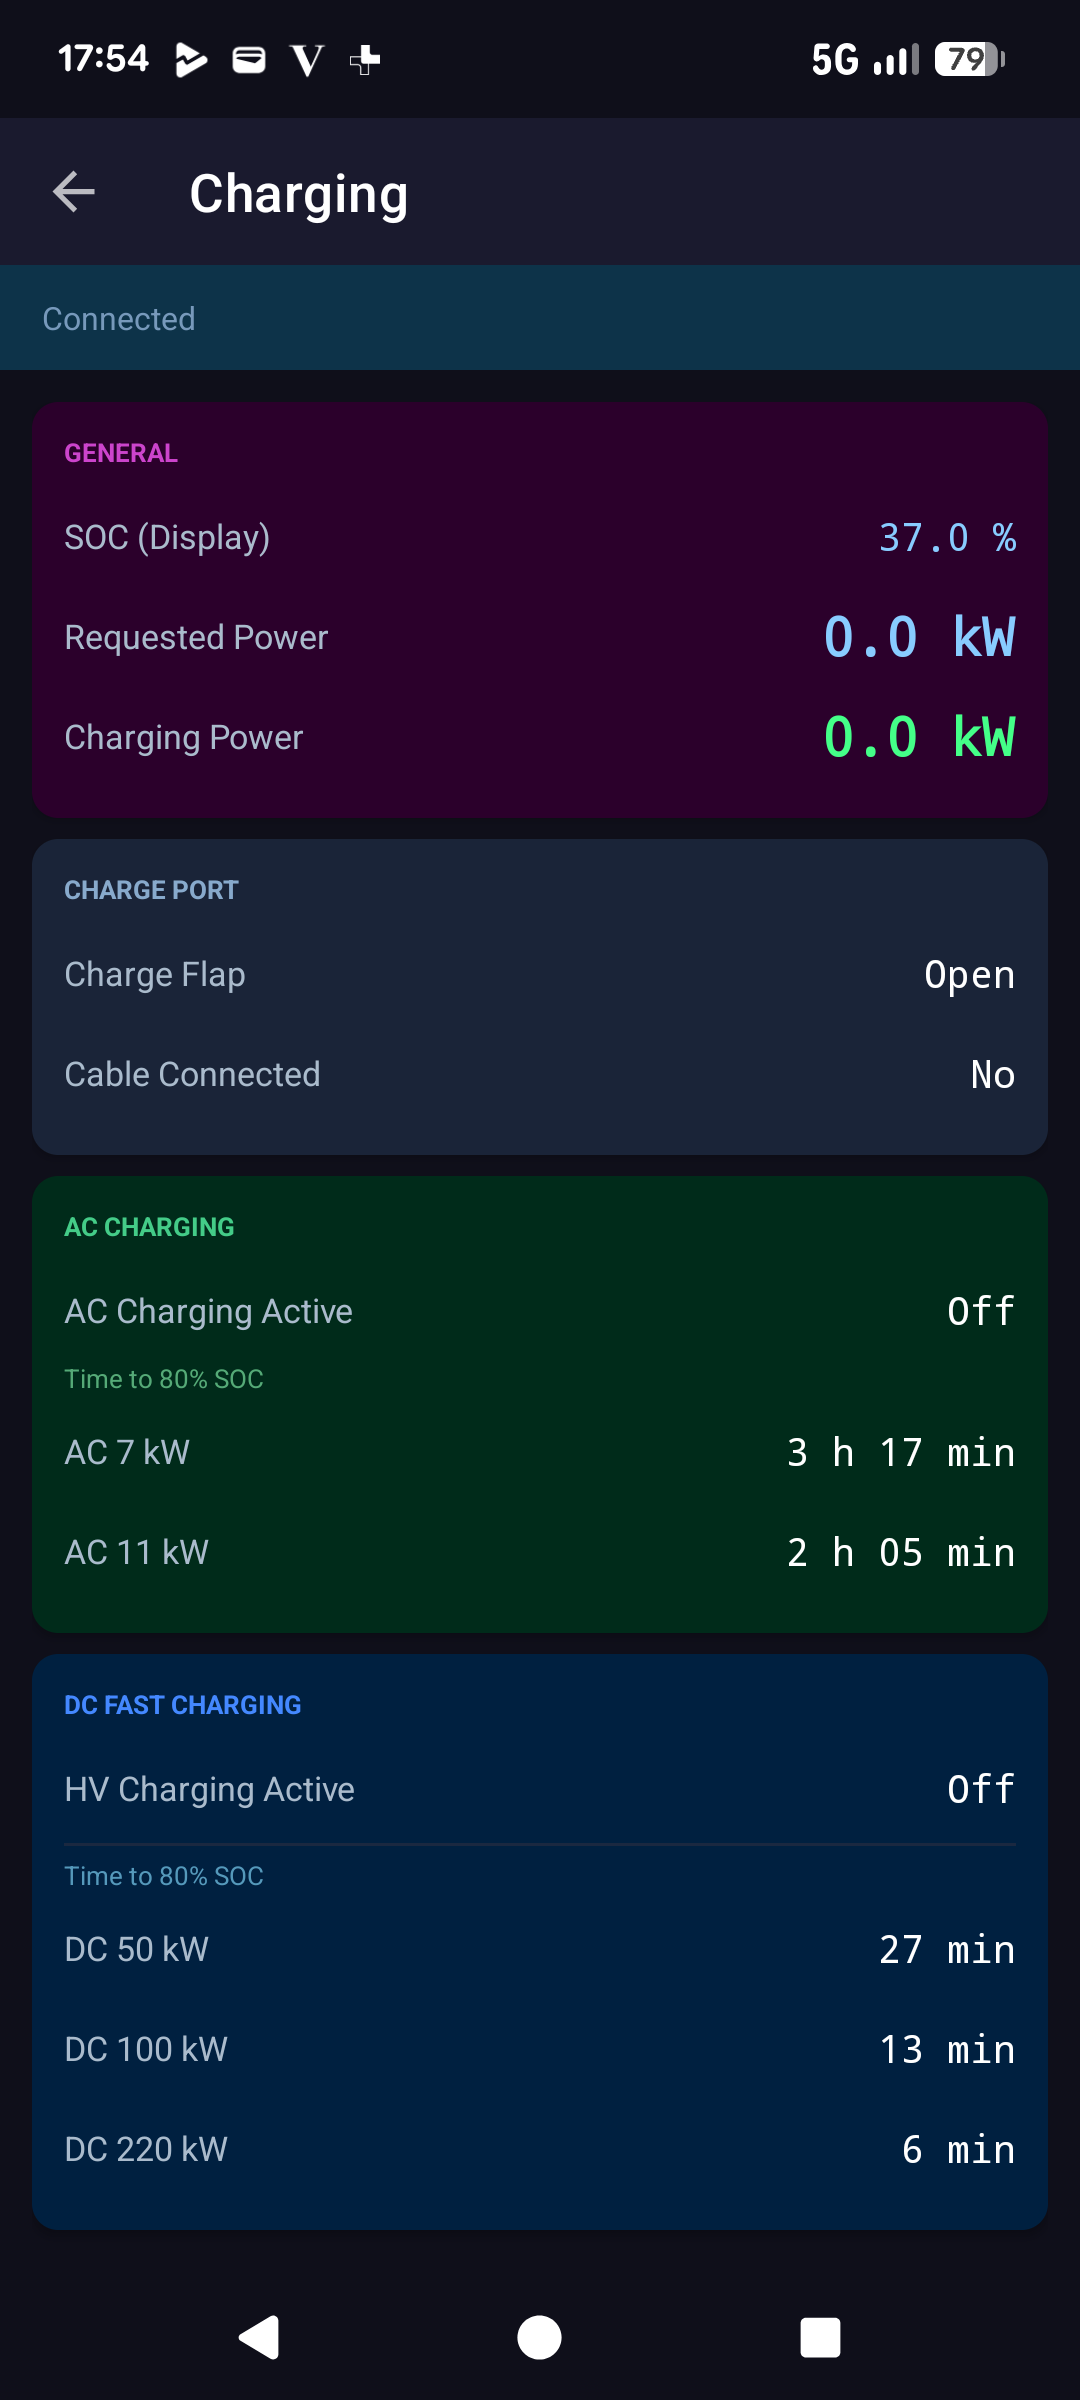
The Charging screen is your go-to view whenever you plug in. The General section shows the display state of charge, the requested power and the actual charging power flowing into the pack. The Charge Port section reports, straight from the car, whether the charge flap is open and whether a cable is connected, real signals rather than guesses.

Separate AC and DC fast charging sections each tell you whether that mode is active and, most usefully, the estimated time to 80% SOC for a range of charger powers, AC 7 kW and 11 kW, and DC 50, 100 and 220 kW. These are calculated live from your current charge level, so you always know roughly how long the wait will be at the charger in front of you.
Charge flap & cable status Requested & live charging power Time to 80% (AC & DC)
Charging on the car screen
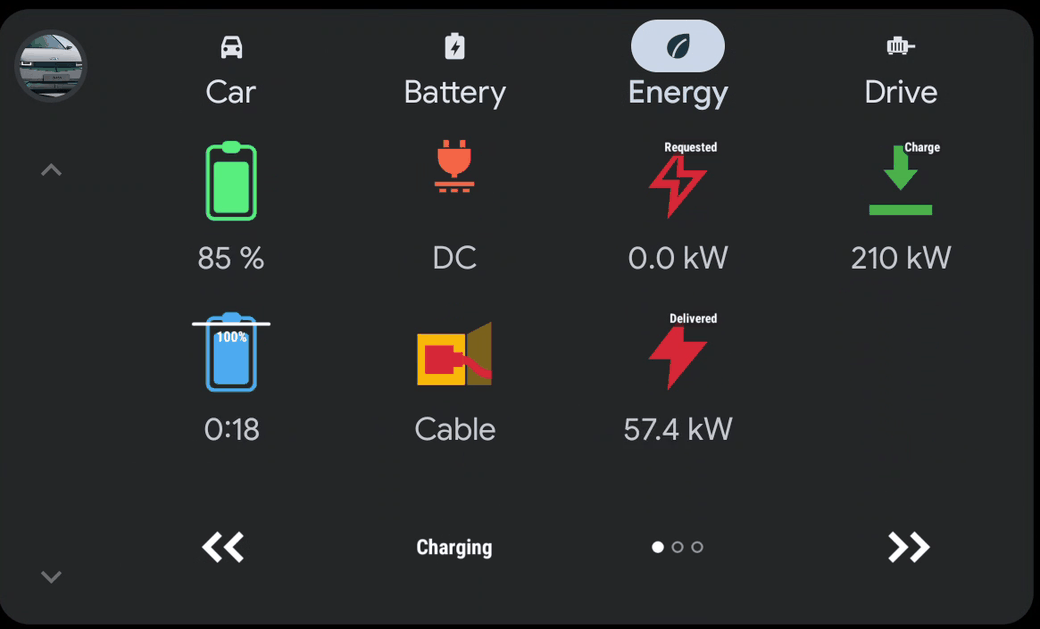
On the car screenCharging. State of charge, whether it is AC or DC, the power asked for and the power actually arriving, the pack’s own limit, what the charge port is doing, and the time to 80 % — the battery picture fills to where you are, with the line at the target and an arrow across the gap.
12V Battery screen

12V Battery

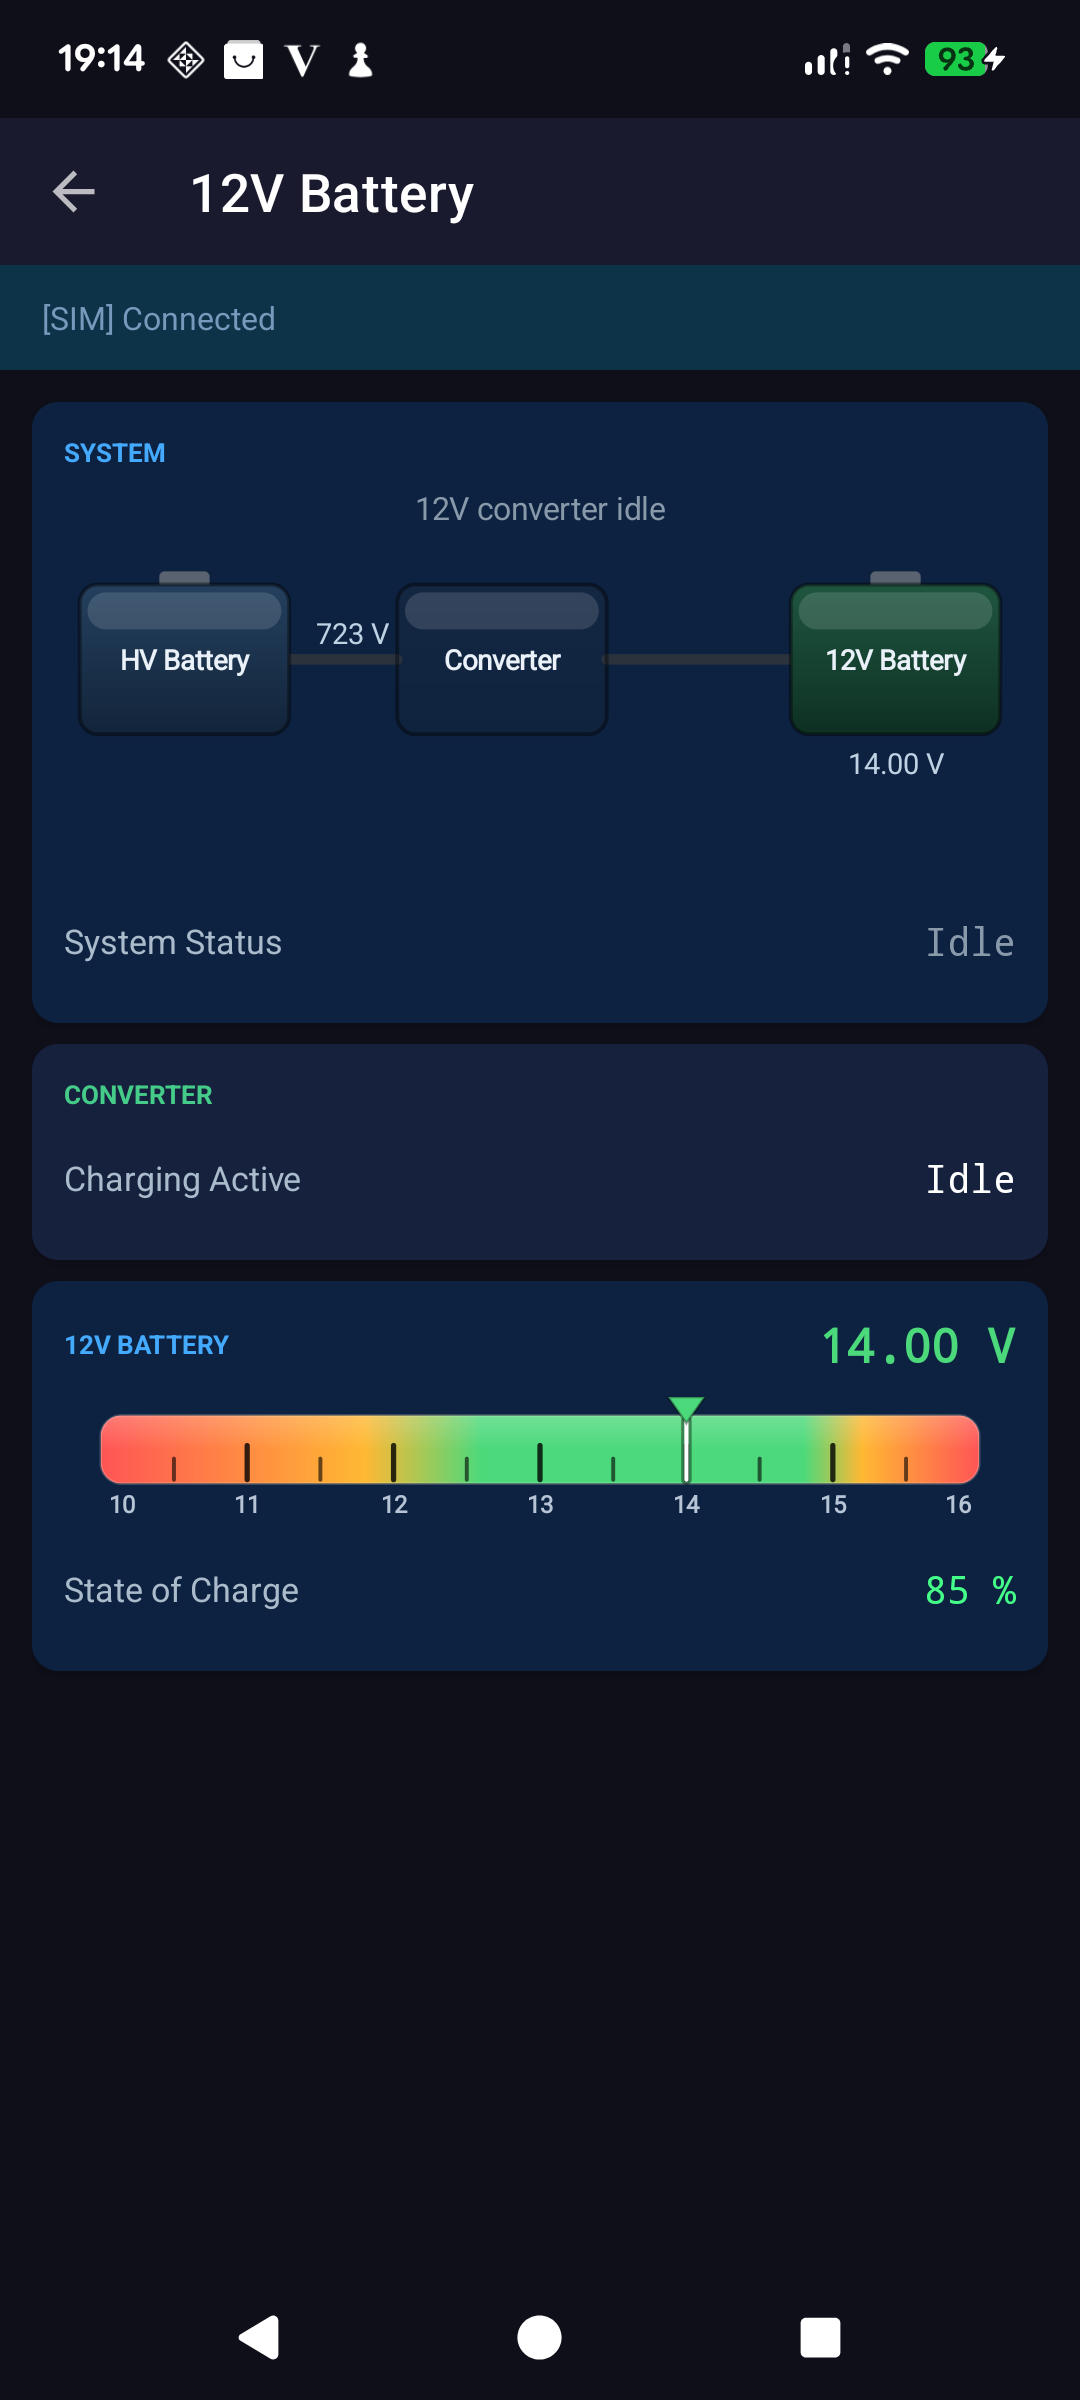
Like every car, the IONIQ 5 has a conventional 12V battery that powers the electronics when the high-voltage system is asleep, and a weak 12V battery is a common cause of mystery warning lights and no-start mornings. The top of the screen draws the power-flow diagram: high-voltage battery → DC-DC converter → 12V battery, with dots that animate along the path while the converter is topping up the 12V battery, so you can see at once whether it is being charged.

The 12V dial

The voltage dial runs from 10 to 16 V with the healthy band in green and the extremes in red. Alongside it you get the 12V battery's state of charge, and a Converter card telling you whether the DC-DC converter is actively charging the 12V battery or sitting idle.

Reading it: with the converter running, the system sits around 13–14.5 V. At rest the converter switches off entirely and the battery is on its own, which is exactly when a tired 12V battery shows itself. A resting voltage that sags below ~12.0 V, or a state of charge that stays under ~60%, is an early warning to have it checked before it leaves you stranded.

12V voltage dial Live power-flow diagram Converter charging / idle 12V state of charge
12V battery on the car screen
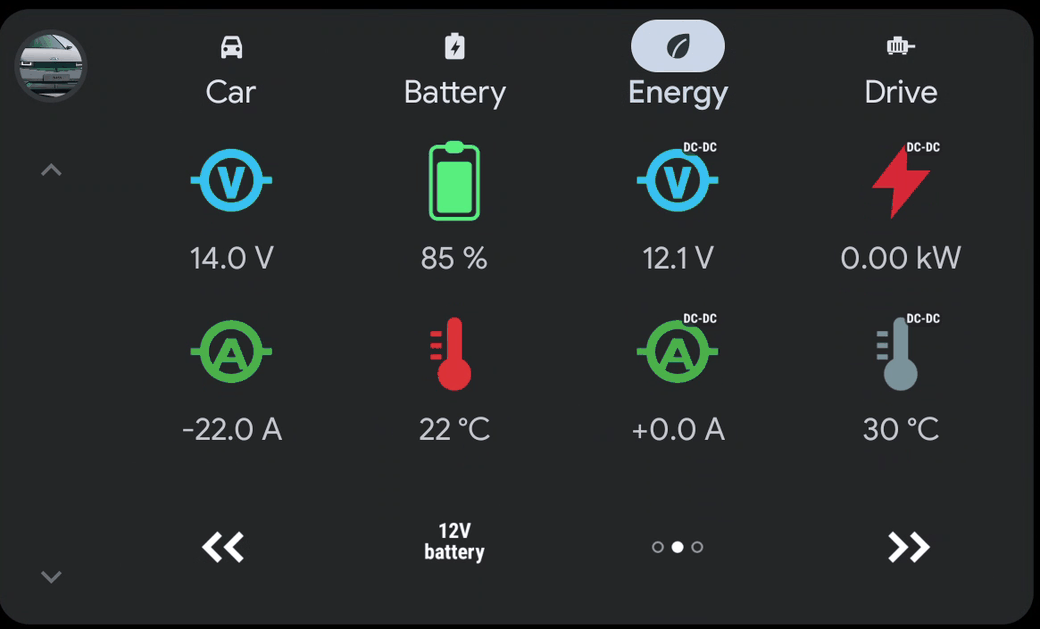
On the car screen12 V battery. Its voltage, state of charge, current and temperature, together with the DC-DC converter that keeps it charged — those four tiles carry a small “DC-DC” mark, because they use the same meters as the battery itself.
Hypermiling screen

Hypermiling

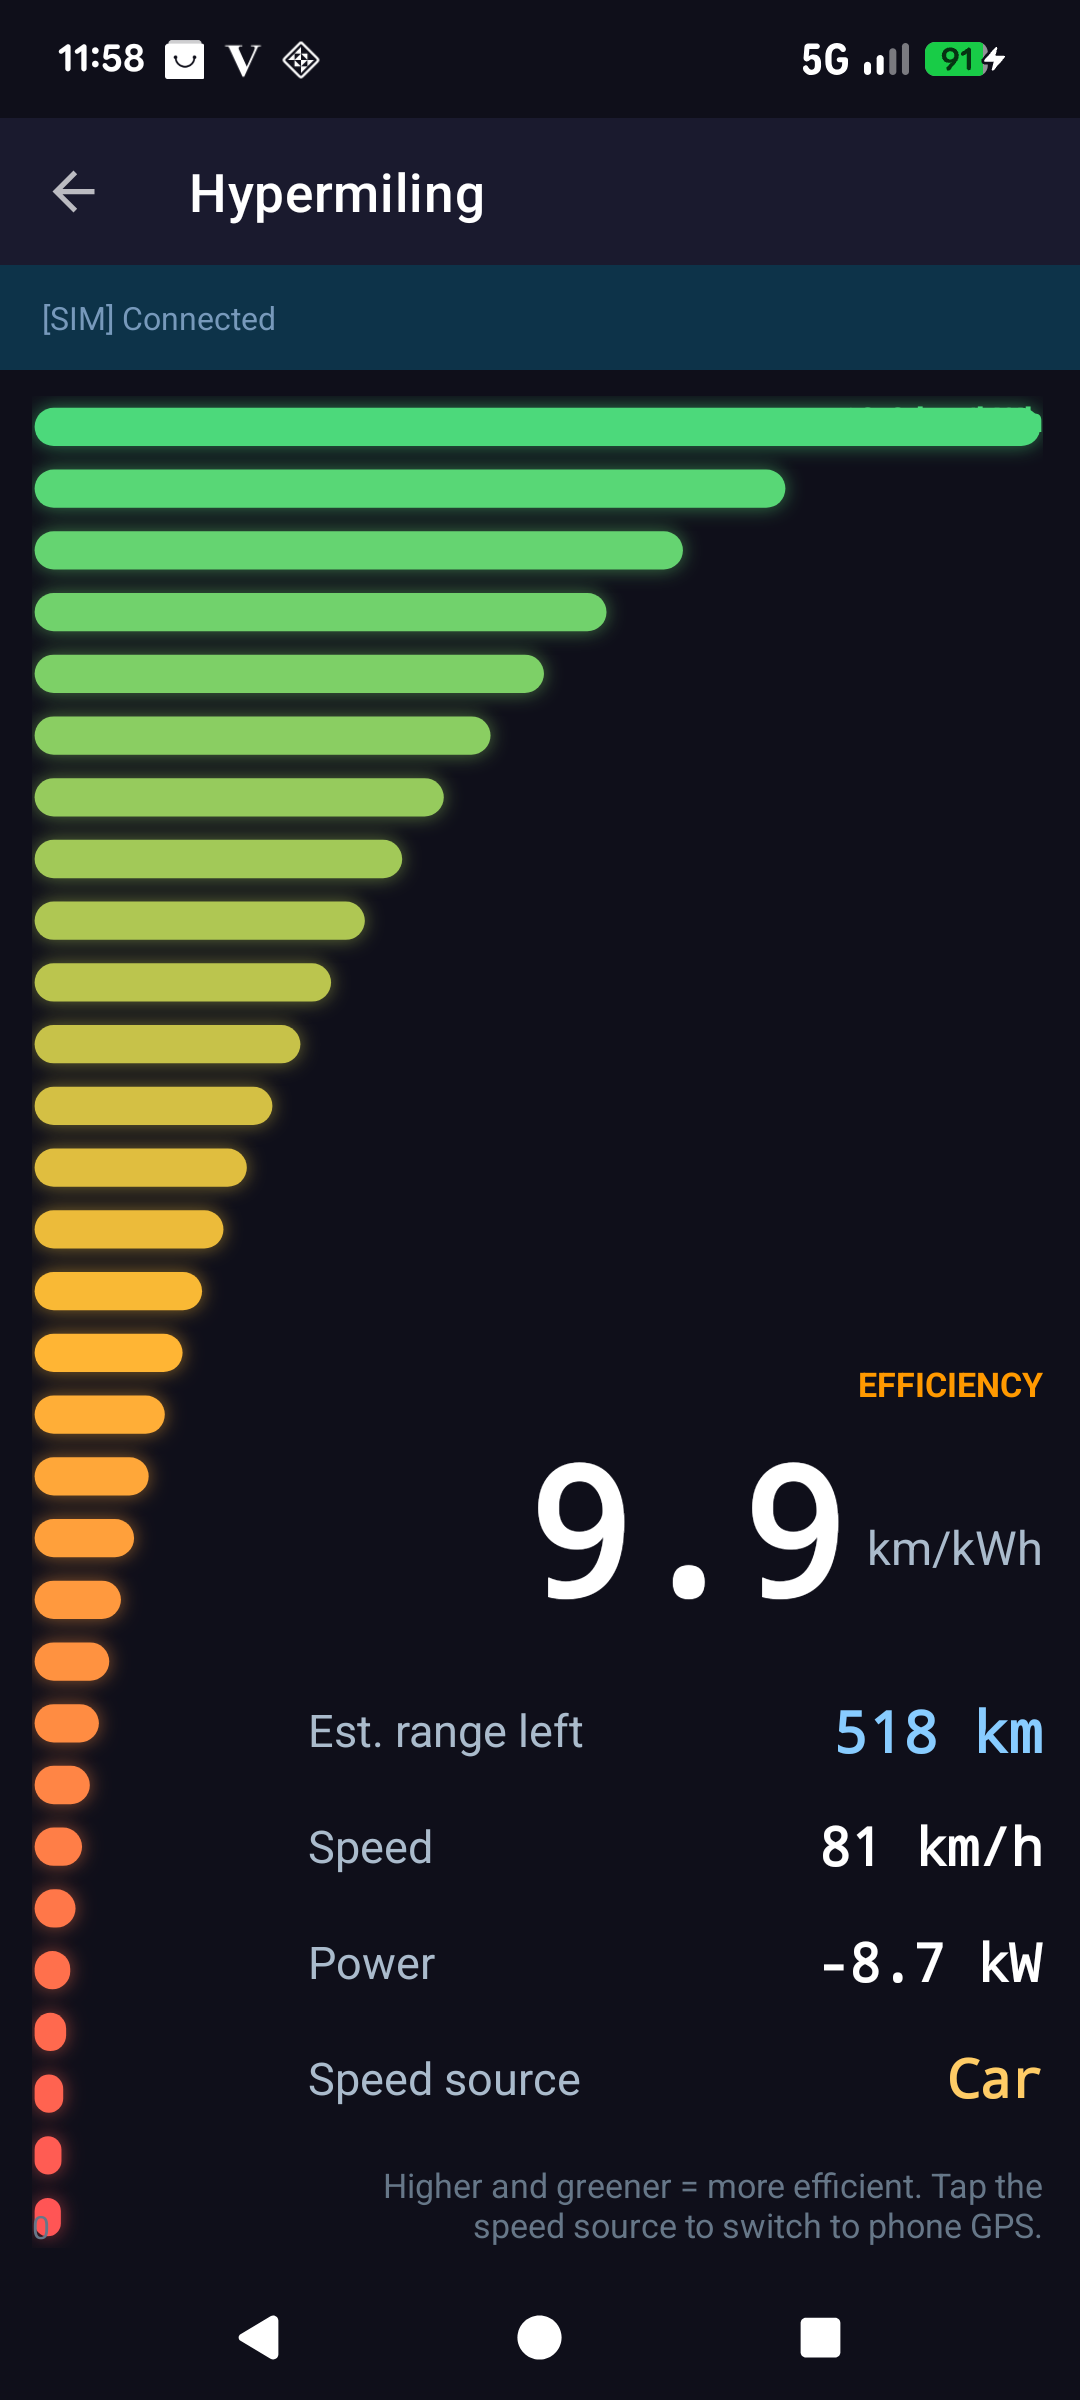
Hypermiling is a live efficiency coach that helps you squeeze more range out of every charge. The big number is your current efficiency in km/kWh, and the tall bar graph beside it is the dial: the bars fill upward and turn greener the more efficiently you drive, and drop down into amber and red when you use more energy.

Reading it: higher and greener is better. Underneath you get the estimated range left at your current efficiency, your speed and the live power (a negative value means you are recovering energy by coasting or braking). The speed source can be tapped to switch between the car's own data and your phone's GPS.

Live efficiency (km/kWh) Estimated range left Speed, power & GPS option
Hypermiling on the car screen
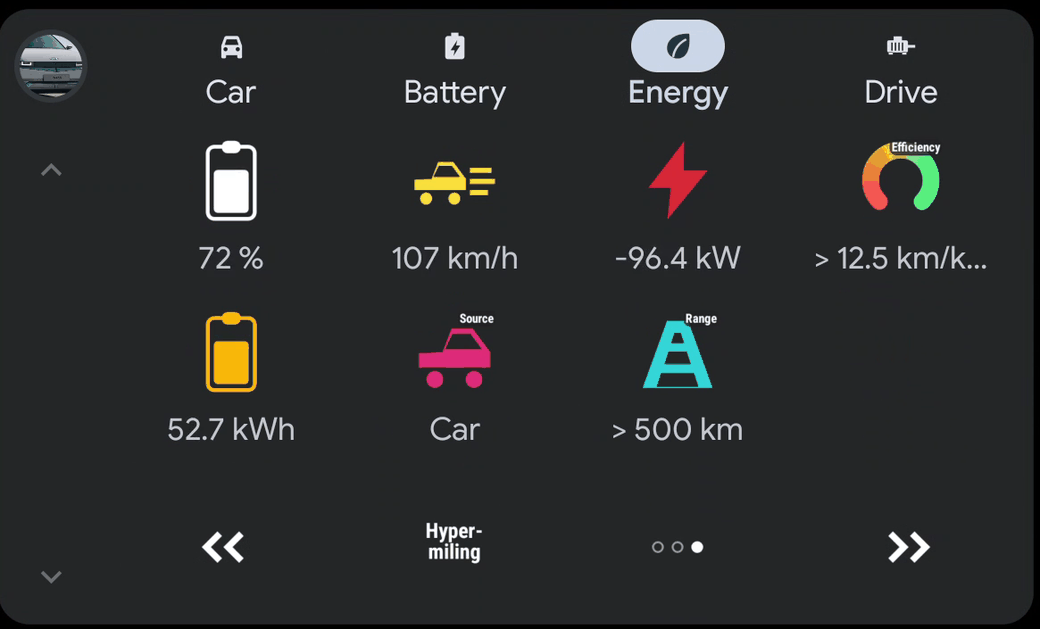
On the car screenHypermiling. State of charge, speed and power with the efficiency ring, and below them the energy left, where the speed comes from (a satellite for the phone’s GPS, a car for the car’s own sensor) and how far that energy still takes you.